Looking to the future
The grid edge model now covers all 11 counties of the Atlanta region. Here's an early look at what it can show.
Heat pump retrofits, building by building


Supply and demand scenarios
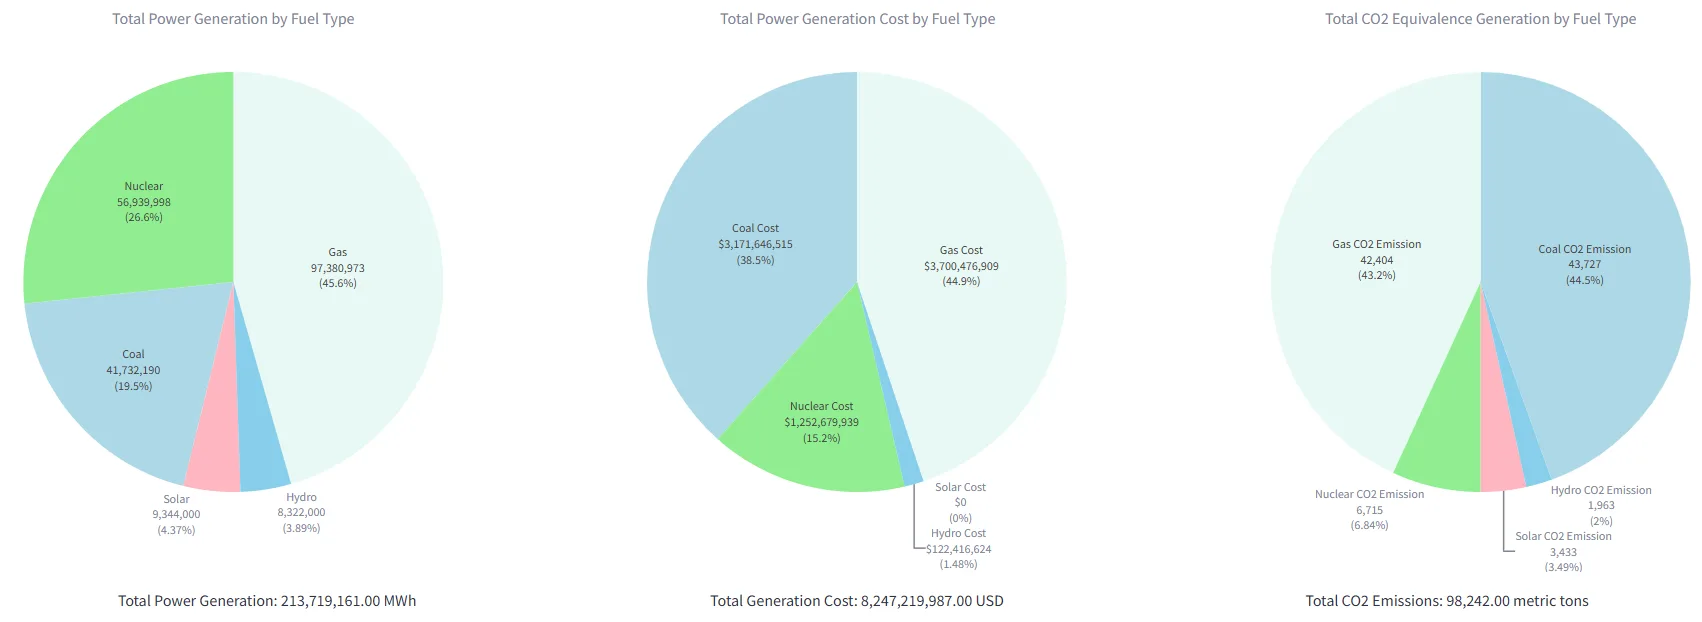
These mock-ups compare how the region's energy mix could change. The black triangle marks the cost and pollution level of each fuel mix.
Today's mix
How the region gets and uses electricity now: the reference point.

Utility investment in renewables
Power companies lead the transition with large-scale renewable projects.

Distributed energy at the grid edge
Customers adopt solar, storage and smart devices behind the meter.

These scenario results are conceptual mock-ups. They are not empirically accurate or drawn to scale.
Solar and batteries soften the peak
On the left, current energy use. On the right, the same area after solar and battery incentives for single-family homes. Residential peaks flatten out.

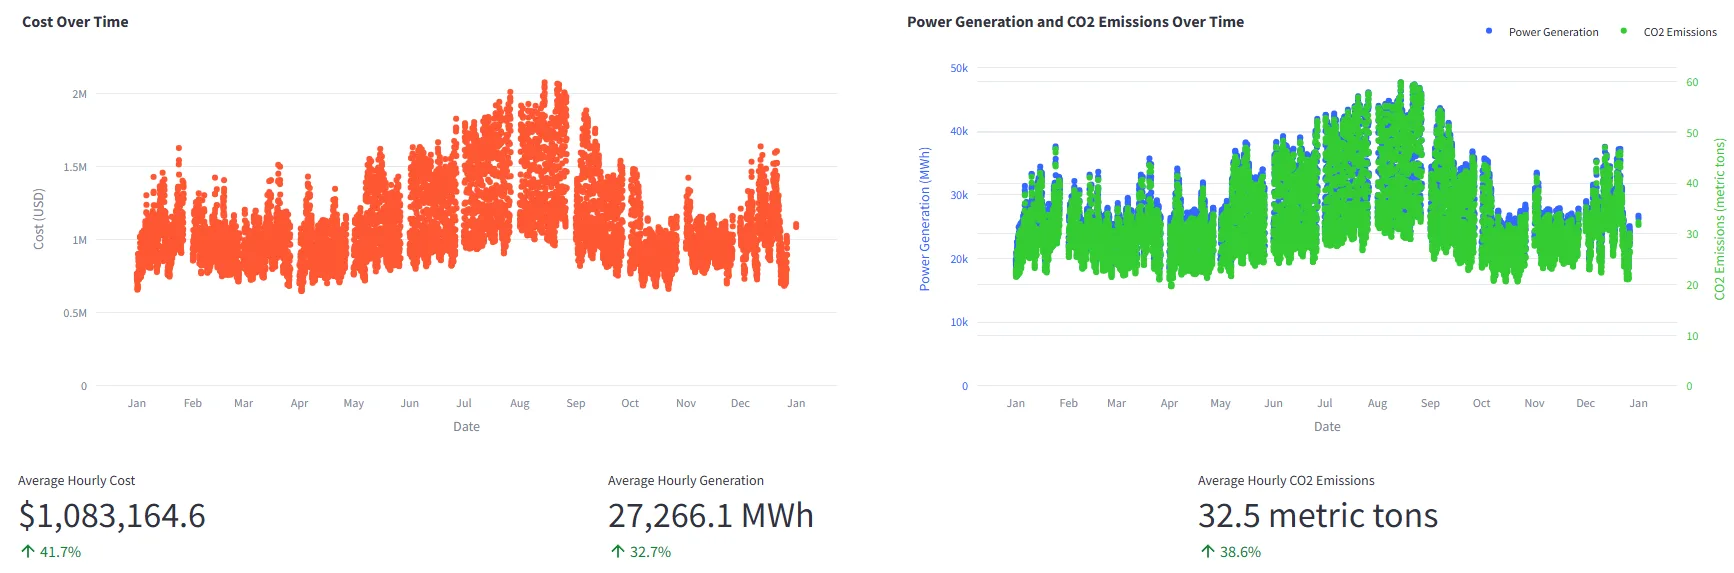
The supply stack in our balancing authority
Southern Company (SOCO) balancing authority.
What the tool will measure
Infrastructure
- Greenhouse gas emissions
- Utility electricity cost
- Electric system reliability
- Value of resilience
Equity and communities
- Consumer electricity cost
- Energy equity for underserved communities
- Jobs and workforce development